Climate—Conflict—Vulnerability Index
Climate—
Conflict—
Vulnerability
Index
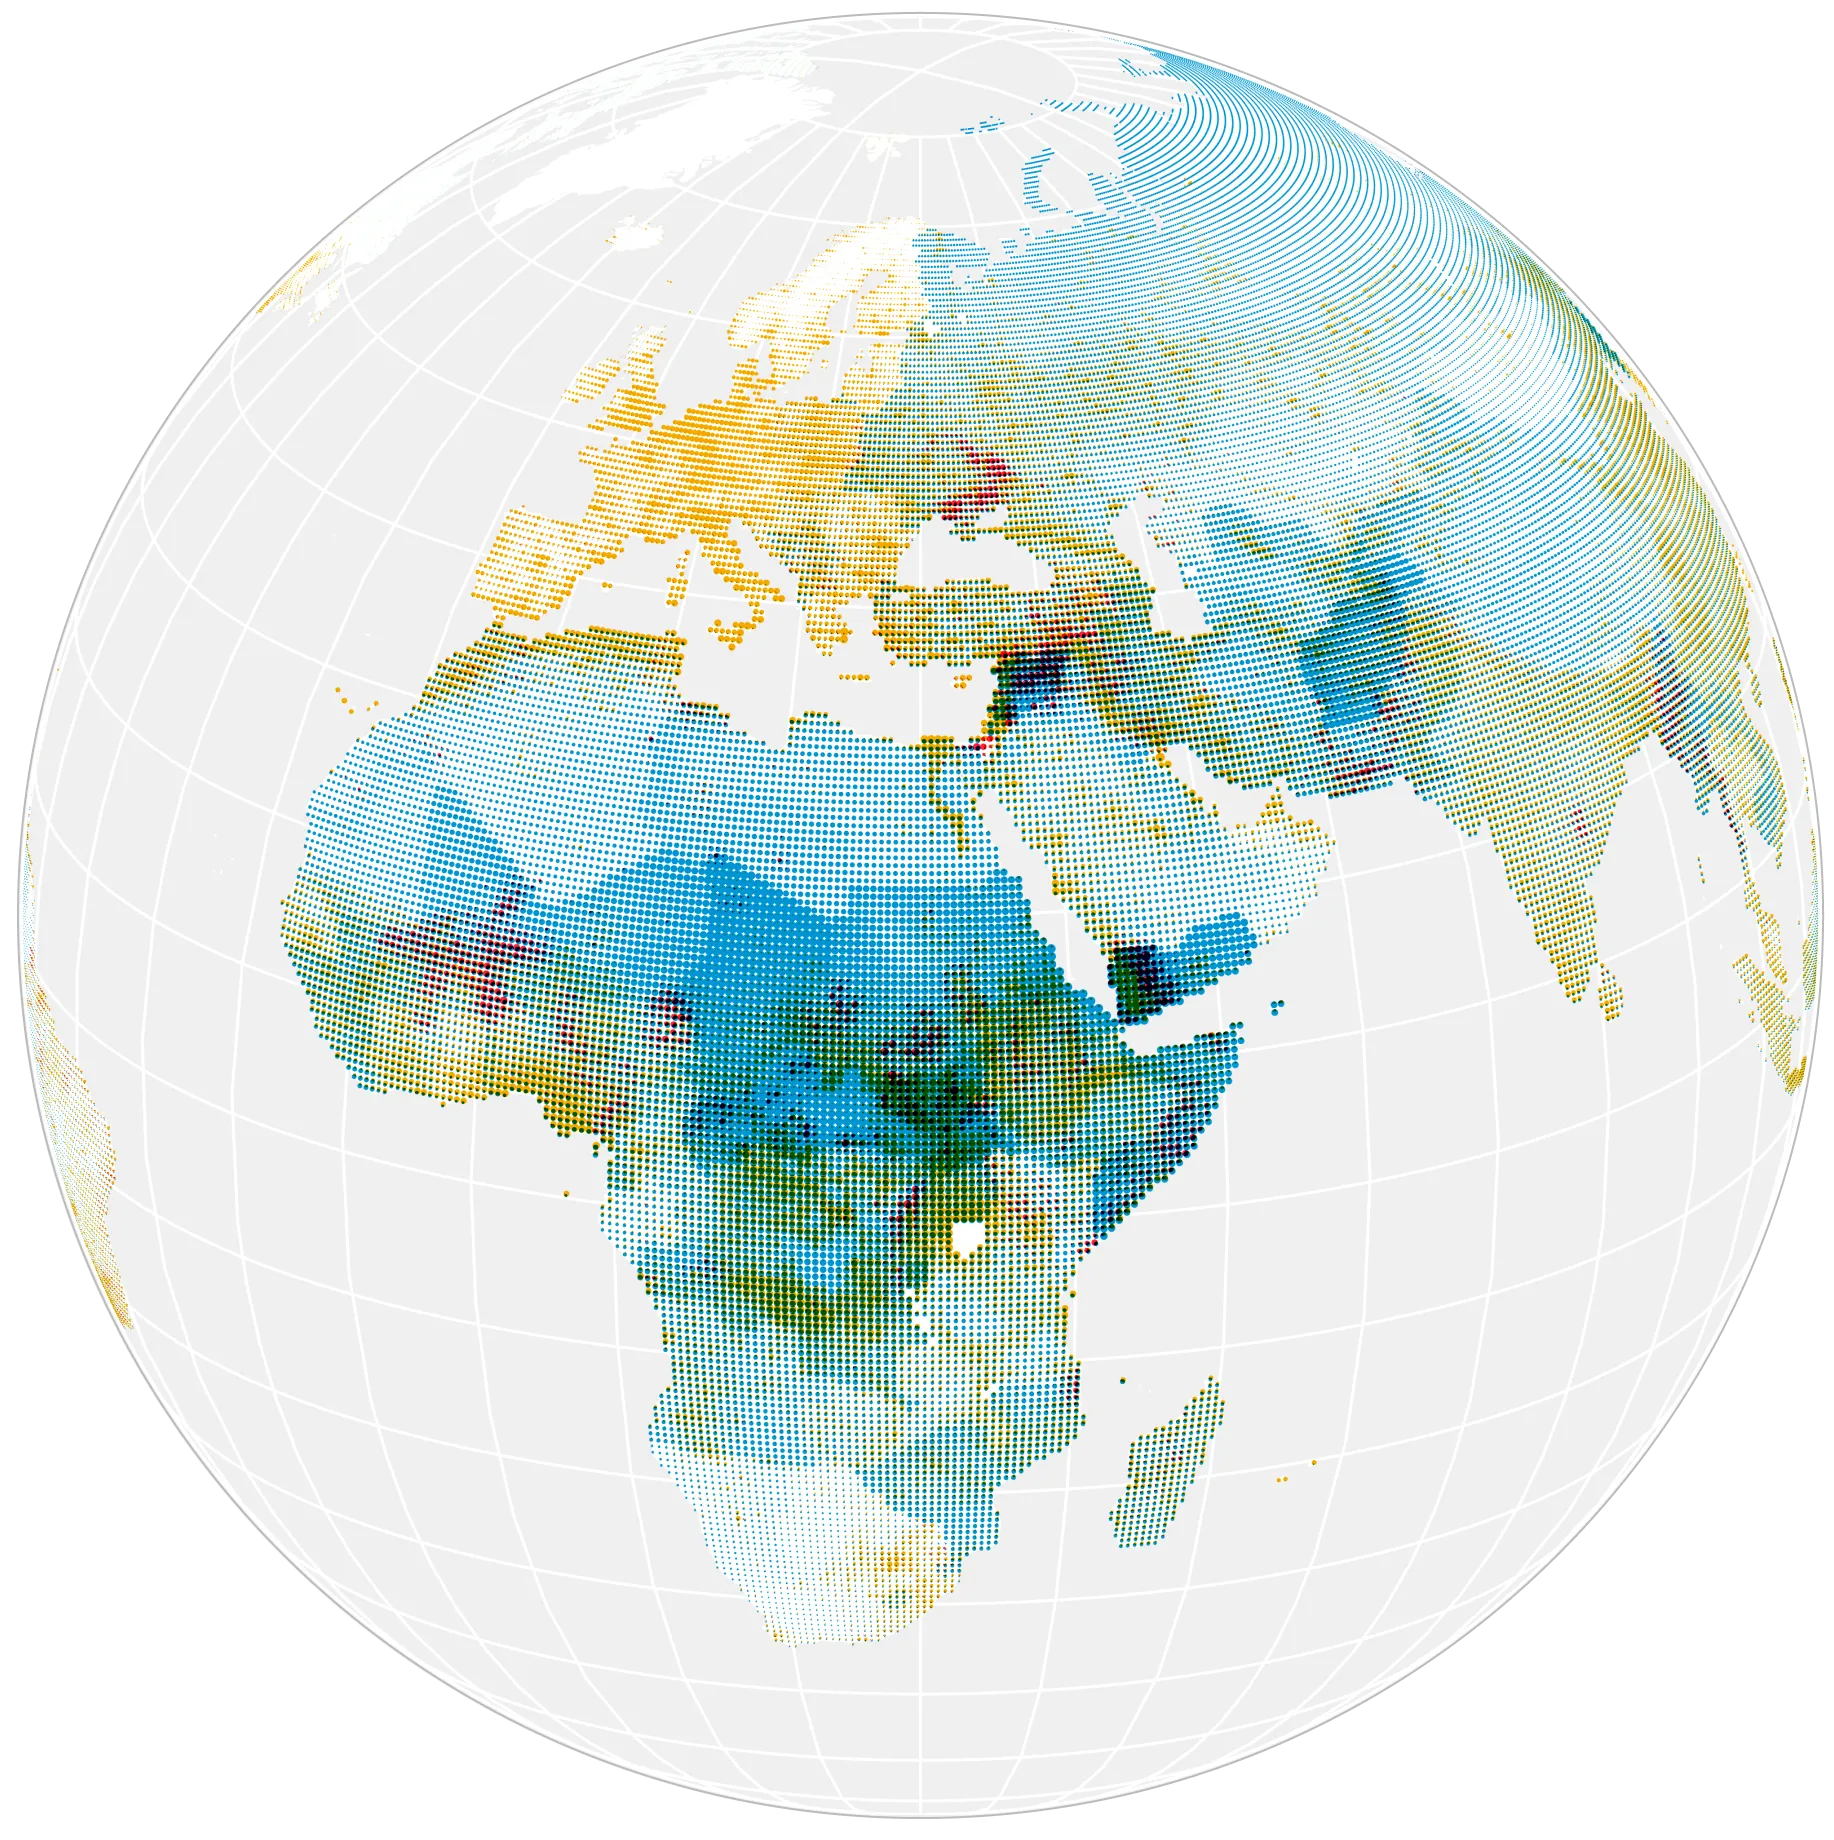
The Climate—Conflict—Vulnerability Index (CCVI) maps current global risks by integrating climate and conflict hazards with local vulnerabilities.
The index comprises a harmonized set of data layers and a transparent scoring methodology to make regions globally comparable.
The data is updated quarterly and gridded to 0.5 degrees
.
Index architecture
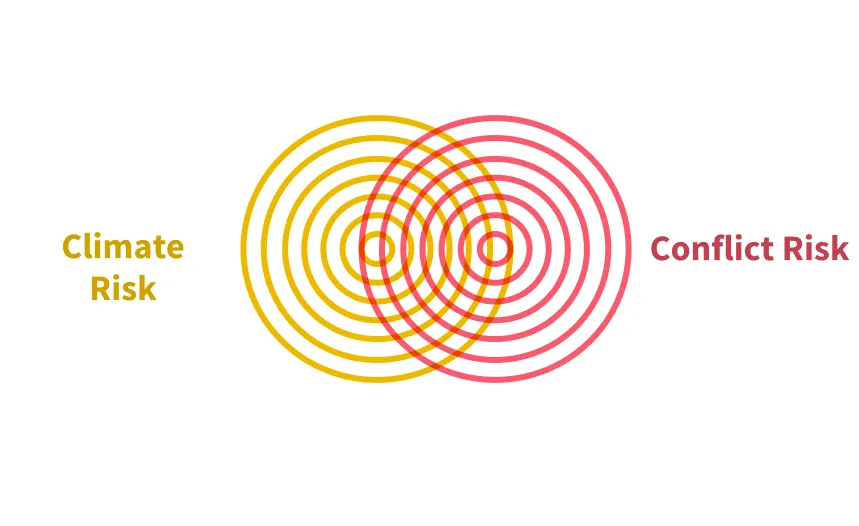
The CCVI investigates the overlap between climate and conflict risks
.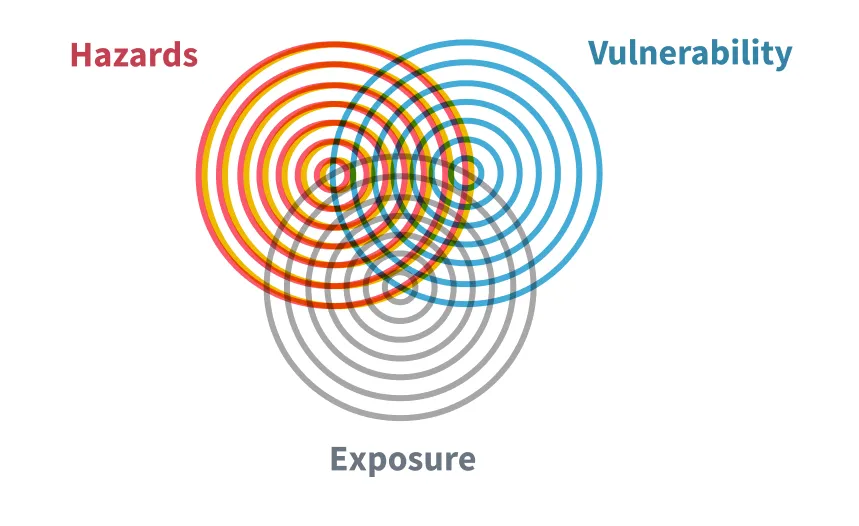
Following the IPCC definition, the climate and conflict risk metrics take hazards
, exposure and vulnerability into account.Hazards create risks only in combination with exposure and vulnerability.
For example, whether a drought (hazard) results in crop losses depends not only on the event itself, but also whether it happened where crops are grown (exposure) and whether the fields are irrigated and enough water from other sources is available (vulnerability).
Understanding and assessing these interactions is essential for managing and mitigating the adverse impacts of climate and conflict hazards in a changing climate.
We organize the underlying data hierarchically in three pillars — climate, conflict and vulnerability. These are further divided into dimensions and indicators.
Climate

The climate pillar captures exposure to climate hazards along three dimensions:
- climate extremes over the past year
- climate extremes accumulated over the past seven years
- changes in mean climate conditions over the past ten years
These hazards are key for assessing climate risk linked to human security. The indicator data are largely derived from satellite observations. These observations are available at high spatial resolution (up to 0.1°degrees), high temporal resolution (ranging from daily to monthly), and are continuously updated.
Climate risk refers to the potential adverse impacts resulting from the interaction of climate hazards, vulnerability, and exposure.
The CCVI captures climate risks with a direct link to human security. This entails risks related to living standards, human health, food security, water security, and peace and human mobility.
Conflict

The conflict pillar captures exposure to organized political violence and civil unrest as a hazard. It includes three dimensions:
- the current level of armed violence, which not only reduces physical security but often also results in destruction and reduction of the economic capacity
- the persistence of armed violence, as violence tends to recur in the same regions once it starts,
- and existing societal tensions that might escalate into armed violence in the future
Conflict-related risks are seen as the result of an interaction between hazards, vulnerability, and exposure to these hazards.
Conflict hazards capture the presence of current or recent violence and unrest, which are endogenously linked to socio-economic and political vulnerabilities. Conflicts take various forms, are perpetuated by different types of actors and materialize at different levels of societal aggregation.
Vulnerability

The vulnerability pillar consists of four dimensions:
- It includes three dimensions: It includes three dimensions:
- socio-economic
- political
- demographic
- and environmental vulnerability
The level of vulnerability is driven by intersecting factors along these four key dimensions, determining to what extent populations exposed to climate and conflict hazards are adversely affected.
The vulnerability pillar draws on the greatest variety of data sources of all pillars. Due to the highly contextual character of vulnerability, the pillar aims to include indicators at the subnational level. Where data is unavailable at finer resolutions, country-level information is used. Within the CCVI, vulnerability in interaction with exposure to climate and conflict hazards determines climate and conflict risk respectively.
Full index hierarchy
Important concepts
Risk
Risk is the potential for adverse outcomes, including those on livelihoods, health, and lives, resulting from interactions between hazards, exposure, and vulnerability. It is typically quantified as the likelihood of an event multiplied by its consequences.
The CCVI focuses on climate- and conflict-related risks to human security, including living standards, human health, food security, water security, and peace and human mobility. Risk judgments vary based on the diversity of values at stake. Given the global scale of these quantitative assessments, they particularly require careful validation against local contexts, as diverse stakeholder groups may prioritize risks differently.
Hazards
Hazards are the potential occurrence of natural or human-induced events or conditions that can cause adverse effects to people, ecosystems, and assets.
The CCVI captures climate hazards as extreme events (e.g., heatwaves) and changes in mean climate conditions (e.g., mean temperature increase). Only climate hazards with high relevance to risks to human security are assessed.
Conflict hazards in the CCVI are measured through fatalities caused by politically motivated, organized violence and instances of public expressions of grievances, which have the potential to escalate into violence. Their negative impacts can materialize at different levels of societal aggregation, from individuals to economic and political systems.
Exposure
Exposure refers to the presence of people, assets, or systems in places that could be adversely affected by hazards. It quantifies to which degree a system is exposed to potential harm.
As the CCVI aims to map risks to human security, it uses population density to capture exposure to hazards. We define human security as “a condition that exists when the vital core of human lives is protected, and when people have the freedom and capacity to live with dignity”. Vital core of human lives comprises material and non-material factors, which enable people to act on behalf of their interests, such as food security, environmental security, community security and political security
Vulnerability
Vulnerability is the susceptibility or predisposition to be adversely affected by a hazard.
Vulnerability is driven by intersecting demographic, social, economic, environmental and political factors. As a result, vulnerability is socially differentiated, varying across and within temporal and geographical scales, as well as levels of societal aggregation.
Data Processing

Data acquisition
We ingest only publicly available data sources, such as climate data from Copernicus Climate Data Store, Armed Conflict Location & Event Data (ACLED) for conflict data, as well as World Bank and other sources for vulnerability data.
Inclusion criteria
Next to the public availability we considered and selected data sources to generate indicators based on the following criteria with descending importance:
- Global coverage
- Subnational spatial resolution
- Sub-yearly temporal resolution
- Current data and short-release cycles
Acquisition process
Given the broad variety of data sources incorporated in the CCVI, we follow multiple approaches in acquiring data. Where possible, we use APIs to automatically download the most recent available data when generating a new version of the CCVI. In all other cases, we manually check the data providers for new data releases and keep a copy of the most recent version available in local storage for further processing.

Harmonization
The input data is used to generate climate and conflict hazards indicators, vulnerability indicators and exposure layers. One CCVI indicator can be based on one or multiple external data sources.
As the data comes in a variety of different formats and resolutions, a harmonization step aligns them on the same temporal and spatial grid and handles outliers and missing values. This enables us to calculate globally comparable normalized metrics and finally aggregate them into risk scores.
Spatial grid
The CCVI is calculated globally, except for Antarctica, and operates on a subnational basis. It uses a spatial resolution of 0.5° x 0.5° aligned with the PRIO-GRID, with a minimum requirement of 25% land per grid cell. This balance ensures detailed tracking of climate and conflict patterns without excessive complexity.
Temporal grid
CCVI data is available on a quarterly basis. This allows for frequent updates to provide users with timely information, which is crucial due to the dynamic nature of climate and conflict dynamics. The data displayed is always the most recent available information, with the data shown in the data recency field.
Indicator normalization
Most indicators follow a min-max normalization approach with winsorization performed where necessary to minimize the impact of outliers and to preserve the most relevant data ranges. Winsorization clips the data to a pre-specified minimum and maximum— for instance, the 5th and 95th percentile. After clipping, the scores are normalized to a range of 0 (lowest value) to 1 (highest value). Natural boundaries like zero are generally preserved during normalization. All normalized indicator scales are oriented so that higher hazards or vulnerabilities are also associated with higher numeric values.

Exposure calculation
After normalization, hazard indicators are combined with their respective exposure layers.
The CCVI uses an exposure layer based on population density as the common exposure variable across all climate and conflict indicators. The rationale behind utilizing population density as a proxy for exposure is to assess impacts of instances of violence (conflict pillar) and climate hazards (climate pillar) to human security.

Aggregation
These combined hazard exposure indicators are then aggregated into dimensions, which are further synthesized into pillar-level hazard exposure scores. Each of these scores is then combined with the vulnerability pillar to generate climate and conflict risk scores.
Aggregation functions
Different varieties of the generalized mean are used to aggregate values along the CCVI hierarchy, depending on the relationship between the individual scores. Where low scores should not be able to compensate for high scores, the quadratic mean is used, where this should be the case the arithmetic mean. If there is a multiplicative relationship (i.e. to calculate risk scores), we employ the geometric mean. Additionally, we employ custom weights based on expert judgements to adjust for unbalanced impacts of different hazards or undue dominance of individual indicators in the overall scores caused by the differences in their distributions.
This approach ensures that significant risks are not diluted in the final assessment, maintaining the impact of pronounced elements in the overall score.
The data sources used to generate vulnerability indicators are updated less frequently and lag up to multiple years behind the present. During aggregation, we use the latest available data to generate the aggregate scores for the current index version.
Aggregation methods
- A
- Arithmetic mean
- G
- Geometric mean
- Q
- Quadratic mean
Aggregation types
Frequently asked questions
Publications
More details on our method and approach can be found in the following documents and publications: